No-distraction. Your granddad's UI design for simple trees and graphs that help you design solutions.
Build interactive decision trees and graphs in Edit Mode, then click through outcomes in View/Demo Mode before shipping your solution.
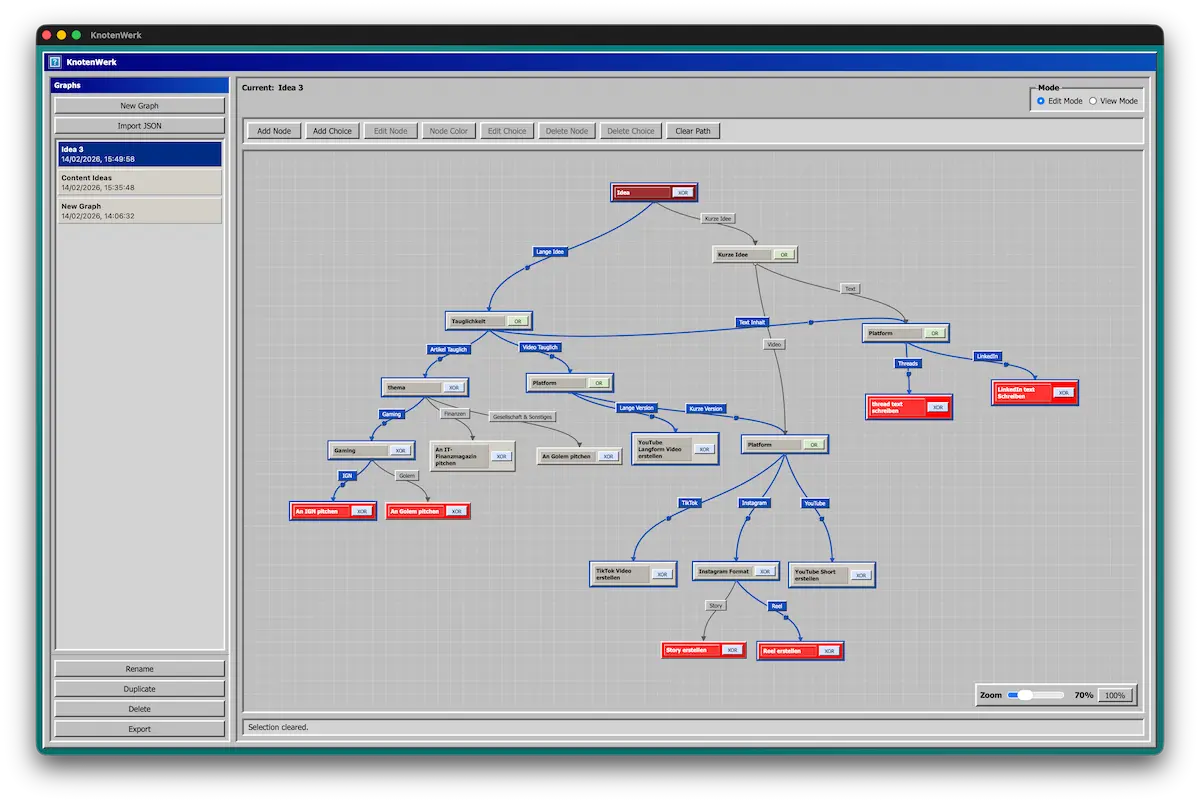
Build interactive decision trees and graphs in Edit Mode, then click through outcomes in View/Demo Mode before shipping your solution.
KnotenWerk keeps the interface intentionally calm: no clutter, just nodes, labels, and paths. It is local-first by default, so graphs are stored as JSON files you own and can move anywhere.
Share the same graph in machine, visual, and documentation formats.
{
  "id": "g_93b853ae-6ceb-4bca-96c8-c0591af61966",
  "name": "Idea 3",
  "version": 1,
  "createdAt": "2026-02-14T14:36:19.996Z",
  "updatedAt": "2026-02-14T14:49:58.603Z",
  "nodes": []
}
## Todo
- [ ] An IGN pitchen
- [ ] YouTube Langform Video erstellen
- [ ] TikTok Video erstellen
- [ ] Reel erstellen
- [ ] YouTube Short erstellen
- [ ] thread text schreiben
- [ ] LinkedIn text Schreiben
SVG export keeps lines and nodes crisp for docs, presentations, and print workflows.
Short answers before you download.
No. You can build decision trees, branching flows, and simpler graph-based structures as long as the logic fits connected nodes and labeled paths.
KnotenWerk is local-first. Graphs are saved as JSON files on your machine, so you can move, version, or back them up however you want.
Yes. View/Demo Mode lets you click through paths and outcomes without staying in the editing workflow.
You can export your graph as JSON, SVG, and Markdown depending on whether you need raw data, a visual asset, or documentation output.
Use Edit and View/Demo modes to build, test, and ship graph-based workflows without distraction.
KnotenWerk is open source.
